Advanced Stats That Changed the Game: How NBA Analytics Reframed Basketball
A box score tells you who scored, rebounded, and passed. It cannot always show how efficiently a player scored, what responsibilities they carried, or how a lineup changed the game. Advanced NBA stats add that context, helping teams and fans ask sharper questions about performance.
Metrics such as True Shooting Percentage, Usage Rate, Offensive and Defensive Rating, plus-minus, and player tracking data have reshaped basketball analysis. Each measures a different slice of the game, though none can explain a player’s value by itself. The real shift is in how analytics combines numbers with roles, tactics, and film.
From box scores to deeper evaluation
Advanced basketball stats add context that points, rebounds, and assists alone cannot provide. They help distinguish a player’s raw production from efficiency, opportunity, team environment, and impact on possessions.
Traditional box-score numbers remain useful: a 30-point night matters. But a scorer who took 30 shots to reach that total had a different offensive performance from one who scored 30 on 18 attempts. Rebounds also depend on opportunity and role; a center may collect more simply because they play near the basket, while a guard’s box score may hide valuable defensive work.
Player Efficiency Rating (PER) offers a single-number summary of a player’s box-score contributions, adjusted for pace and playing time. It can help summarize broad production, but it is not a definitive ranking: PER favors visible counting stats and does not fully capture defense, off-ball movement, or how a player fits a team’s system.
The larger change is a move from “How many did he score?” to “What did he produce per possession, under what role, and with what effect on the team?” Pace and possessions matter because a fast team creates more chances for everyone to accumulate counting stats. Adjusting for pace makes comparisons across playing styles more meaningful, though it still cannot erase differences in teammates or responsibilities.
Measuring scoring more accurately
Effective Field Goal Percentage (eFG%) and True Shooting Percentage (TS%) measure scoring efficiency while accounting for the extra value of three-pointers and, for TS%, free throws.
Effective Field Goal Percentage adjusts ordinary field-goal percentage by giving three-pointers extra credit: eFG% = (field goals made + 0.5 × three-pointers made) ÷ field goals attempted. A made three counts as more scoring than a made two, so eFG% compares shooting output more fairly than field-goal percentage alone.
True Shooting Percentage goes further by including free throws. Its common estimate is points divided by twice the sum of field-goal attempts and 0.44 times free-throw attempts. The 0.44 is an approximation that accounts for different kinds of free-throw trips. TS% therefore offers a broad view of scoring efficiency across twos, threes, and foul shots.
Consider two players who each score 20 points. One gets there with a steady diet of efficient shots and free throws; the other needs many attempts and rarely reaches the line. Their point totals match, but their TS% can reveal a meaningful difference in how much of the team’s offense they used to produce those points.
Neither measure tells the whole story. eFG% excludes free throws, while TS% does not distinguish a self-created shot from an open catch-and-shoot opportunity. Pair them with shot charts, role, and video to understand whether efficiency came from repeatable skill, smart shot selection, or a favorable stretch.
Understanding role and impact
Usage Rate, Offensive and Defensive Rating, and plus-minus help explain a player’s role and how team performance changes with them on the floor. They answer different questions, so they should be read together rather than treated as interchangeable grades.
Usage Rate estimates the share of a team’s possessions a player ends with a shot, turnover, or trip to the free-throw line while on court. A high usage rate signals a large offensive workload, not necessarily good or bad performance. A primary creator may need to take difficult shots late in the clock; comparing that player with a low-usage finisher without considering role misses the point.
Offensive Rating estimates points produced per 100 possessions, while Defensive Rating estimates points allowed per 100 possessions. Team ratings are useful for comparing units across pace, but individual ratings are strongly shaped by teammates, opponents, and lineup context. They are measurements of outcomes, not clean proof of individual responsibility.
Plus-minus records the scoring margin while a player is on the court. Lineup data expands the view by showing how combinations perform together. These figures can surface patterns, such as a bench group that consistently creates defensive stops, but small samples and uneven opponent quality can distort them. A player may have a strong plus-minus because they share minutes with a dominant teammate.
A practical reading order is: check the player’s role and minutes, examine efficiency and usage, then review team and lineup results. That sequence helps separate individual production from the situation around it.
Tracking data and the geometry of the court
Player tracking data shows where players move, how quickly they move, and how their positioning shapes space. Combined with shot charts and shot quality, it reveals tactical patterns that a traditional box score cannot record.
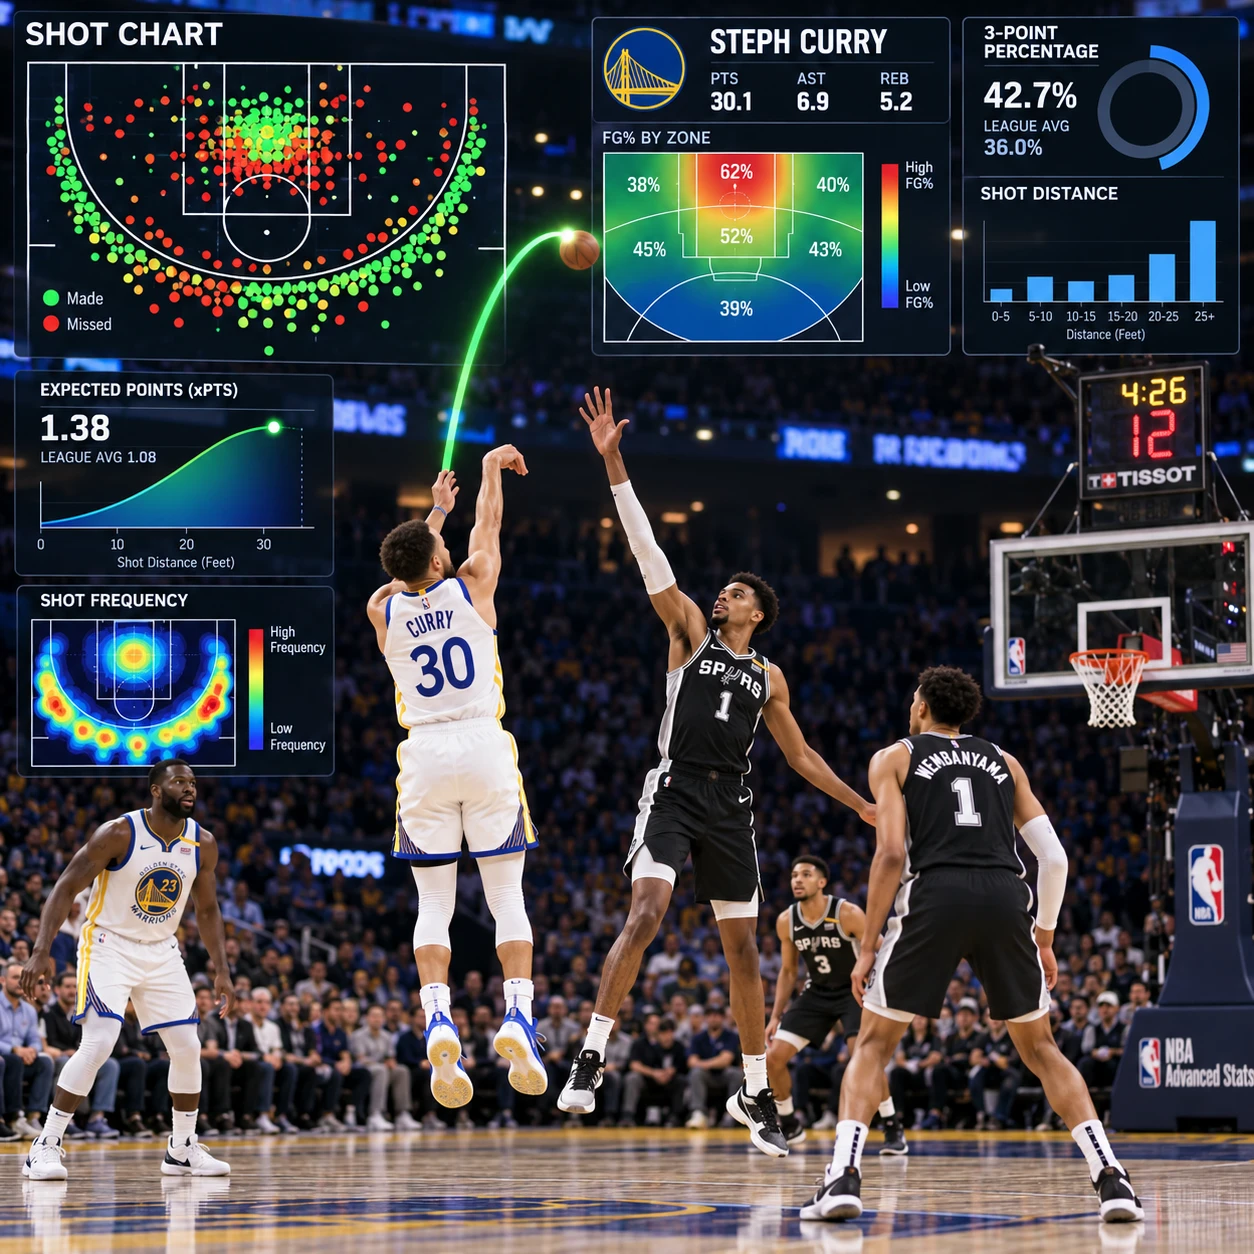
Shot charts map attempts by location and outcome. They can show whether a player is effective at the rim, from the corners, or above the break, and whether their shot diet matches their strengths. Shot quality estimates how favorable an attempt was based on factors such as location, defender distance, and shot type. A missed open corner three and a contested long two both count as misses, but they are different decisions.
Tracking data also measures movement off the ball: cuts, screens, drives, and distance covered. A player who draws a second defender may create an open shot for a teammate without recording an assist. Spacing matters for the same reason. When defenders must respect several shooters, driving lanes widen and help defense becomes harder to organize.
These tools changed how teams study offense. Rather than asking only whether a shot went in, analysts can ask whether the team created a good attempt, how the defense reacted, and what action produced the opening. The limitation is that tracking data describes movement and location more readily than intent. Film is still needed to tell whether a rotation was late, a screen was effective, or a player made the right read.
How teams use analytics to make decisions
NBA teams use analytics to inform scouting, lineup choices, player development, and in-game strategy. Data narrows the questions and tests assumptions, while coaches and scouts weigh the basketball context before acting.
In scouting, a team might look beyond a prospect’s scoring average to examine TS%, Usage Rate, turnover tendencies, shot locations, and performance against different coverages. A high-volume scorer with poor efficiency may need a different role at the next level; an efficient player on limited touches may have room to take on more responsibility. Neither conclusion follows from one statistic alone.
Coaches also use lineup data to assess combinations. If a team’s spacing collapses when two non-shooters share the floor, staff may stagger their minutes or adjust the surrounding players. Defensive ratings and tracking data can help identify whether a unit struggles at the rim, gives up corner threes, or loses matchups in transition. In-game, possession and shot-quality analysis can support decisions about pace, shot selection, and defensive coverage.
Analytics does not dictate every move. A lineup that rates well in a small sample may not hold up against a playoff opponent, and a player’s health, communication, or assignment can matter more than a statistical edge. The most useful process is iterative: identify a pattern in the numbers, review the film, test a tactical adjustment, then check whether the problem changes.
What advanced stats can’t tell us on their own
Advanced stats cannot fully explain performance without sample size, role, teammates, opponents, defensive responsibilities, and video context. They describe evidence; interpretation still requires basketball knowledge.
Small samples are especially risky. A shooter’s percentage over a few games can swing sharply with makes and misses, while a lineup may have played together for too few possessions to establish a reliable trend. Before drawing a conclusion, check how many attempts or possessions support it and whether the same pattern appears over a longer stretch.
Role creates another challenge. A player asked to guard the opponent’s best scorer may spend less energy on offense. A center instructed to protect the rim may concede some perimeter space by design. Defensive statistics often struggle to assign credit or blame for rotations, switches, deterrence, and communication, which is why no single defensive metric reliably captures the full job.
Common misreadings include:
- Treating PER as a final ranking: It compresses box-score production into one figure but can miss defense and team fit. Use it as a summary, then inspect the underlying role and skills.
- Calling high Usage Rate inefficient by default: Heavy creation often comes with difficult attempts. Compare efficiency with workload and responsibilities.
- Reading plus-minus as individual causation: Teammates and opponent lineups influence the result. Check lineup combinations and the length of the sample.
- Assuming tracking data explains intent: Location and movement show what happened spatially, not always why. Review the possession on film.
Advanced stats changed the game by improving the questions asked about it. They help compare scoring efficiency, understand offensive workload, study lineup impact, and map the geometry of the court. Their strongest use comes when a metric points to a pattern, film tests the explanation, and basketball judgment decides what to do next.